P-SAP™
People . Performance . Retention
Back to pragadian.com
P-SAP™ Glossary

The Language of Your Assessment

Every insight in a P-SAP™ report, in plain English. On the surface, a clear idea you can act on. Underneath, the science that makes it trustworthy.

Assess the Signal. Not the Action.
01

The Score

Overview and Synergy Score

Assessment Overview and Synergy Score

One honest number for how well a person's system is actually performing, not how busy it looks.

02

Truth and Bias

Response Integrity Engine

SVCI Triangulation and Marker Scoring

A proprietary layer that cross-checks every answer against real behaviour and established science across six human performance markers, so you see the truth, not the polished version. It counters the self report bias that undermines conventional surveys.

This is why the results hold up when ordinary survey numbers do not.

Consistency Check

Bias and Drift Analysis

Reveals the gap between how people see themselves and how they actually operate, catching the blind spots ordinary surveys miss.

03

What Is Happening Now

Performance Profile

Performance Profile

A clear read on how someone is really operating beneath the surface.
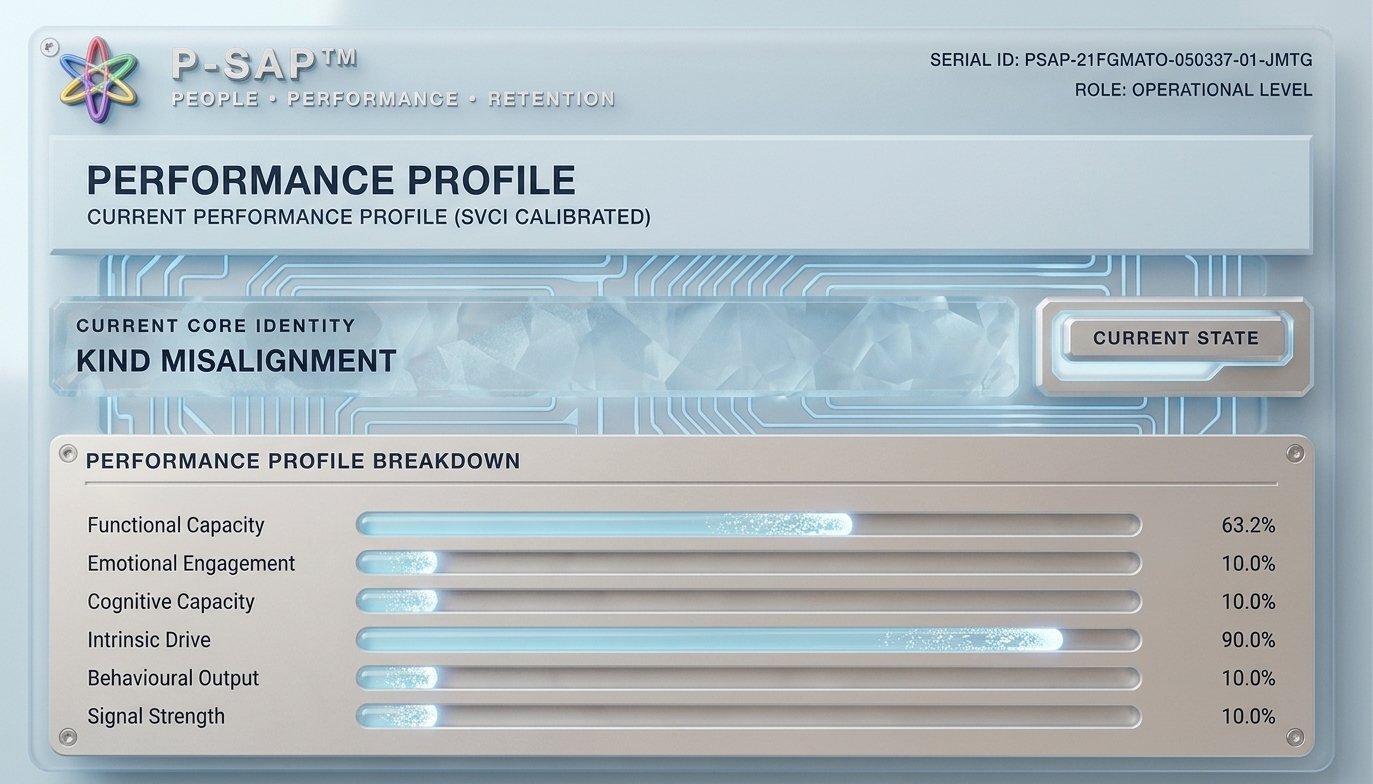
Pragadian P-SAP performance profile report showing a Synergy Score breakdown across six dimensions: functional capacity, emotional engagement, cognitive capacity, intrinsic drive, behavioural output and signal strength.
A sample P-SAP™ performance profile: the Synergy Score, broken down across six dimensions of a person's working state.

Working Style

Work Orientation

The natural way a person engages with work, people, and pressure.

04

Hidden Drags

Hidden Performance Risks

Masked Effects

The silent drains that keep results looking fine while quietly eroding the system.

Blocked Potential

Suppressed Effects

Real capability that exists but cannot break through, the talent you already have but cannot yet see.

05

Risk and Retention

Risk Forecast

Risk Forecast and Depletion Chain

A forward look at where a person is heading if nothing changes, so you can act before the drop.

Foresight, while there is still time to change the outcome.

Disengagement Index

Systemic Withdrawal Index, SWI

An early warning read on how likely someone is to quietly check out.

Attrition Risk

Attrition Risk Index

A clear signal of who may be at risk of leaving, while there is still time to act.

Retention starts with seeing the risk early.
06

Trust and Rigour

Standards Alignment

ISO Mapping Reference

Every insight mapped to recognised international standards, giving your findings a language leaders and auditors already trust.

The Science Behind It

P-SAP™ Scientific Basis

The doctoral research and established principles that make the results credible, not guesswork. The founding framework and its measures are published in open access white papers: PMHS™ Framework, Masked Effect, and Suppressed Effect.
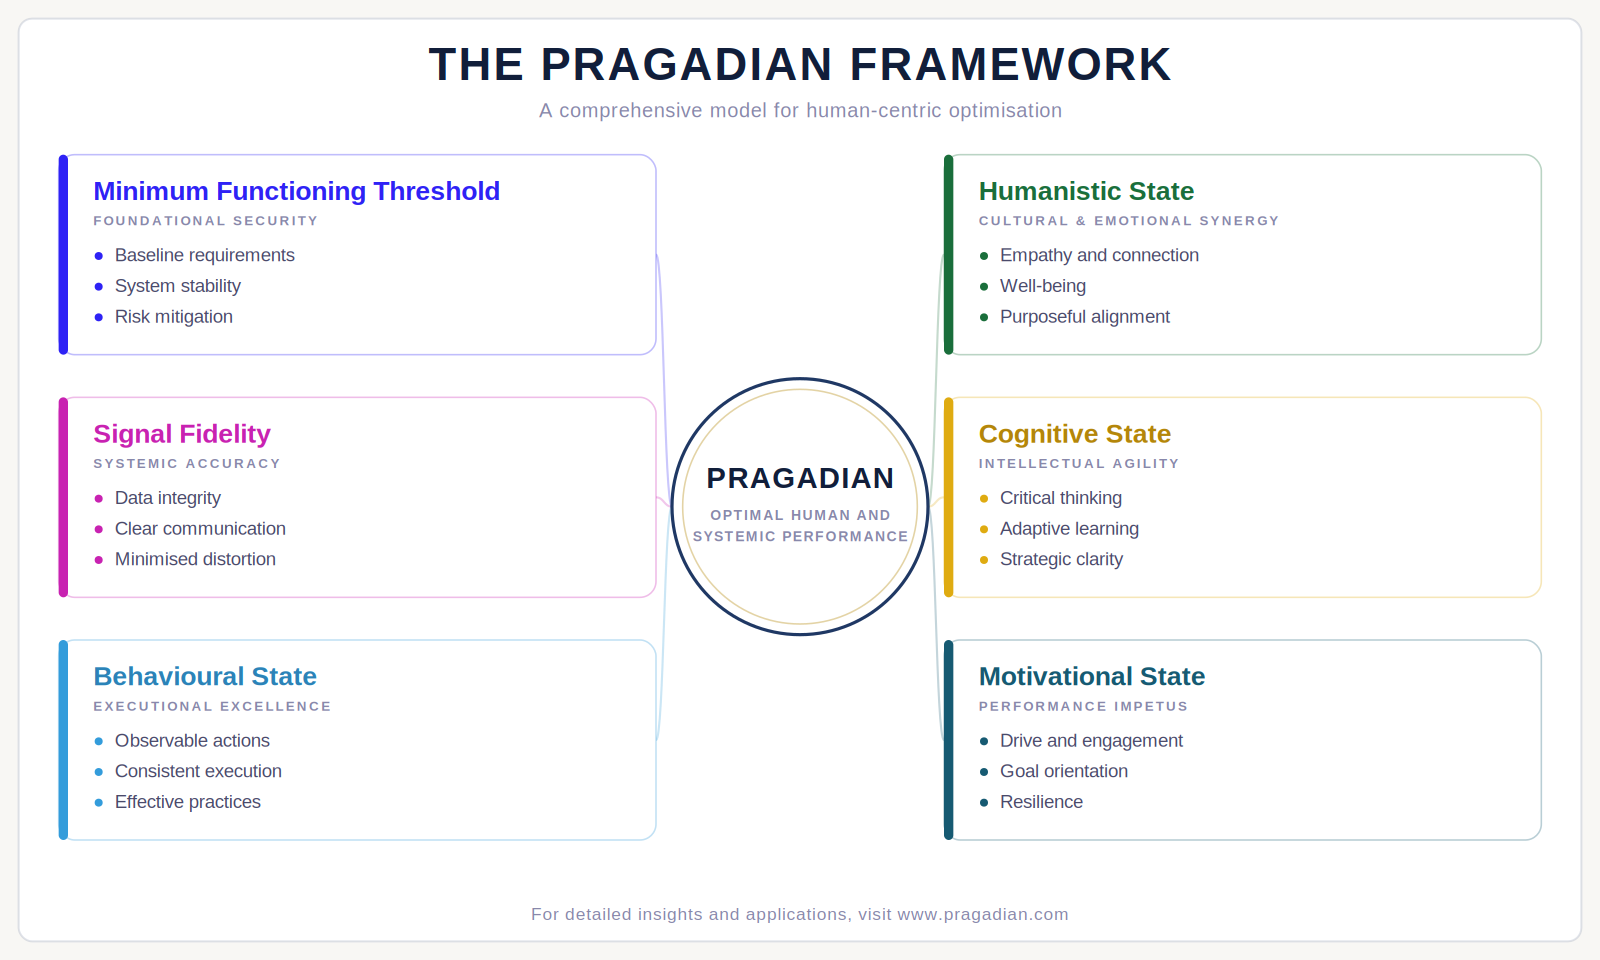
The Pragadian Framework diagram: six interdependent states of human and systemic performance, minimum functioning threshold, humanistic, cognitive, motivational, behavioural and signal fidelity, around a central optimisation core.
The Pragadian Framework: six interdependent states that shape human and systemic performance, the foundation beneath the P-SAP™ assessment.

Frequently Asked

Short answers to the questions people ask most.

What is the P-SAP™ assessment?
P-SAP™, the Pragadian Synergy Alignment Profile, is a structured organisational assessment that measures the real health of how a person or team performs. It moves beyond self reported opinion to read the system underneath, so leaders can see capacity, hidden risk, and retention signals in one place.
How does P-SAP™ reduce self report bias?
Every answer is cross referenced against observed behaviour and established scientific reference points through a proprietary integrity layer. Where a person's self view drifts from their behavioural reality, the assessment flags and adjusts for it, so the result reflects how people actually operate rather than how they wish to appear.
Can P-SAP™ predict employee attrition risk?
P-SAP™ produces an early warning read on disengagement and an attrition risk band derived from structural patterns, not intention. It is a leading indicator that helps leaders act before someone withdraws, and it is guidance for decision making, not a deterministic prediction.
What makes P-SAP™ different from a conventional engagement survey?
A conventional survey records opinion at a moment in time. P-SAP™ triangulates each response against behaviour and science, surfaces hidden drags and blocked potential, forecasts where a person is heading, and maps findings to recognised international standards. The output is a diagnosis of the system, not a satisfaction score.

See the signal in your people

Explore how the P-SAP™ assessment turns everyday responses into a clear, honest picture of performance, risk, and retention.

Explore P-SAP™